4 Public User Data Entry Protocol
4.1 Preamble
Thank you for your interest in contributing your data to the COMPADRE Plant Matrix Database (COMPADRE hereafter) and the COMADRE Animal Matrix Database (COMADRE hereafter). Our online data entry portal is designed to make this process as straightforward and simple as possible. This guide describes the steps of the data entry process (from creating an account to submitting your completed data), the confirmation process that happens after data submission, and a comprehensive protocol for each form including definitions and examples. If you have any questions along the way, feel free to reach out to us at contact@compadre-db.org.
4.2 Account Creation
The first step in the data entry process is account creation. You’ll find a link to create your account on the compadre-db.org homepage. On the right side of the top banner, click Links followed by Register.
Registration for compadre-db.org is intentionally minimal since the data you choose to submit to the database are entered manually rather than pulled from an account form. All you’ll need to enter is your Name, Email, and a Password of your choosing. Once you select Register, a confirmation email will be sent to your account. After confirming your email, you’ll be able to login to your User Dashboard by clicking Links and Login on the right side of the top banner.
4.3 Protocol Overview
Data you submit to the COMPADRE or COMADRE databases is entered manually using three types of digitization forms: (1) The Publication form which contains metadata on the publication, such as bibliographic and study level information; (2) The Population form form with metadata that allows for the interpretation of the matrix data, and it pertains to information at the species/population level; and (3) the Matrix form which contains the matrix population models themselves, as well as information that is matrix-specific.
Note: We use the term Publication in the Publication form for simplicity. In this form, you’ll be able to select whether your data come from a Book, Book Chapter, Journal Article, Thesis (which includes PhD Dissertations), Report, Conference, or Other (which includes preprints and unpublished data).
You’ll enter and edit data using your User Dashboard. You can edit your data at any time prior to using the Submit button to send your data for review by our digitisation team. Once you Submit data for review, it cannot be changed unless our digitisation team sends it back to you for correction.
After submission, a notification is sent to our digitisation team, and your data is queued for review. Once our team has determined all fields and forms are complete, the data will be released to our database and included in the next version release of COMPADRE or COMADRE. Version releases occur in the first month of each quarter of the calendar year and intermittently between the quarterly releases if deemed necessary by the digitisation team.
4.4 The User Dashboard
The User Dashboard is where you’ll create and manage your data submissions to COMPADRE and COMADRE. There are four links at the top of the dashboard.
Add New Publication- Begins the data entry process by creating a newPublicationin the Publication formMy Publications- Contains a list of yourPublications. From here, you can continue working where you left off or check the status of submitted dataAdd New Species- Adds a new species if your species was not listed in theSpeciesselection of the Population formManage Profile- Allows you to change theNameandEmailassociated with your account
4.5 Values used throughout the database
The following values are commonly used throughout the database.
NA- Not available - The information is not available either because the author does not have it or because the information is not applicableAFI- Asked for it - (Note: This option for form fields primarily used by the digitisation team since we are not the source of the data.) The information is not yet in the database, but the digitiser has already contacted the author requesting it (i.e. the author has not yet replied)NDY- Not digitised yet - The information has not yet been digitised. This is likely to occur when some priority information has been digitised for a given species, and the digitiser has moved onto another species without contacting an author for the missing informationNC- Not calculated - Information was not calculated because its calculation is not sensible. For instance, latitudes and longitudes of various populations of the same species are not averaged and assigned to the grand-mean population matrix of the species. This is the same for ranges, where the author provides a range of latitudes and longitudes for a given population. Ranges are instead noted in theObservationscolumn of the Matrix formLAB- Laboratory - The author collected demographic data for the studied species in a laboratory or under greenhouse conditions. Controlled, typically indoor, conditions that mean the study population is not affected by the environmental conditions typical of the actual geographic location of the studyFRANK- Frankenstein matrix - Frankenstein matrices are MPMs where the author parameterised their model using demographic data from 2+ other papers/sources; in other words, when the matrix values come from a source that was not affected by the same conditions as the rest of the matrix. These MPMs should be clearly indicated with “FRANK” in theObservationscolumn of the Matrix form. Furthermore, geographic location data, time information (start/end year, season etc.) should be recorded only if the author reports ONE main location for the matrix; if multiple locations are reported, then it should be recorded asFRANKand notNA.Simulation- A simulated matrix - The matrix model is a simulation, and perhaps only loosely based on a specific real species. Typically, these simulated matrices are used to explore the behaviour of a population in a theoretical way. In those cases, there is no geographic location, ecoregion etc. For these data we do not calculate averages or ranges for locations and time periods but instead enterSimulation(notNA).
4.6 Important References
- Caswell, H. (2001) Matrix population models. Second Edition. Sunderland, MA: Sinauer Associates.
- Olson, D.M., Dinerstein, E., Wikramanayake, E.D., Burgess, N.D., Powell, G.V., Underwood, E.C., D’amico, J.A., Itoua, I., Strand, H.E. & Morrison, J.C. (2001) Terrestrial Ecoregions of the World: A New Map of Life on Earth A new global map of terrestrial ecoregions provides an innovative tool for conserving biodiversity. BioScience, 51, 933–938.
- Salguero-Gómez, R., Jones, O. R., Archer, C. R., Buckley, Y. M., Che-Castaldo, J., Caswell, H., Hodgson, D., Scheuerlein, A., Conde, D. A., Brinks, E., de Buhr, H., Farack, C., Gottschalk, F., Hartmann, A., Henning, A., Hoppe, G., Römer, G., Runge, J., Ruoff, T., Wille, J., Zeh, S., Davison, R., Vieregg, D., Baudisch, A., Altwegg, R., Colchero, F., Dong, M., de Kroon, H., Lebreton, J.-D., Metcalf, C. J. E., Neel, M. M., Parker, I. M., Takada, T., Valverde, T., Vélez-Espino, L. A., Wardle, G. M., Franco, M., Vaupel, J. W. (2015), The COMPADRE Plant Matrix Database: an open online repository for plant demography. Journal of Ecology, 103: 202–218. https://doi.org/10.1111/1365-2745.12334
- Kendall, B.E., Fujiwara, M., Diaz-Lopez, J., Schneider, S., Voigt, J., Wiesner, S. 2019. Persistent problems in the construction of matrix population models. Ecological Modelling 406, 33–43 https://doi.org/10.1016/j.ecolmodel.2019.03.011
4.7 Protocol for the publication form
4.7.1 Status
This is the status for the publication. Please READ the website-status protocol to determine the status that should be assigned to the publication.
Assigned– the publication has been assigned to a node. The digitiser will get publications in this status. Once the digitiser has started working on the publication, it should be changed to “Digitizing”Digitizing– digitiser is working/editing the populationRejected/DeletedAwaiting info– digitiser has determined more information is required to complete digitizationReview-Ready– the population is ready to be reviewed by a database curatorReleased– population can be now seen by public usersError– an error has been found in the population and needs to be corrected
4.7.2 Node Assignment
The node the publication has been assigned for. Only coordinators and admins edit this field.
4.7.3 Assigned to
The name of the digitiser that has claimed or has been assigned the publication.
4.7.4 Database
The database to which the publication belongs to, either COMPADRE (plants, fungi, and algae) or COMADRE (animals, bacteria, and viruses). Usually determined by the database coordinator. When you are assigned a publication, always make sure the assigned database is correct.
Compadre(plants, fungi, and algae)Comadre(animals, bacteria, and viruses)
4.7.5 Attach a Document
Attach all files used to digitise this publication. Include original journal article, additional sources, appendices, files from author communications, PDF copies of emails from the author if data are in the text of the email, Excel files with data, etc. Usually all proposed/assigned publications will have the original journal article attached.
Important: If you must calculate matrix entries from formulas/models and tables in the publication, do that work in an Excel file (or third party software such as Google Docs and save as an Excel file), and upload your work to the publication form.
4.7.6 DOI/ISBN
The DOI of the journal article. If you have the DOI, you could automatically fill the bibliographic information fields. Check to make sure those fields were populated correctly.
4.7.8 Reference Type
Record the type of reference from which data were sourced.
- Book: Matrices are from a book
- Book Chapter: Matrices are from a single chapter in a book
- Journal Article: Matrices come from a Journal paper.
- Journal Name: Record the standard abbreviation of the journal using the BIOSIS format. For journal abbreviations, click “Full list of journal abbreviation” (https://images.webofknowledge.com/images/help/WOS/A_abrvjt.html). If no abbreviation is available in the list, search past records of the journal from the website or look for it in the left corner of the paper.
- Year: The year the paper was published.
- Thesis: Matrices are from a thesis such as PhD thesis, MSc thesis, etc.
- Thesis type: Select the correct option.
- Report: Matrices are from a report.
- Conference: Matrices are from a conference in forms such as a talk or a poster.
- Other: Matrices are from other sources including, but not limited to archives.
4.7.9 Purposes
Select all that apply. Describes the purpose(s) of the study detailed in the manuscript. This information is usually obvious from the abstract and the last paragraph of the introduction. Several purposes are possible per study.
We have categorised the purposes as follows:
- Comparative demography - When the authors studied two or more species
- Spatial demography - When the authors studied the demography of two or more populations within the same species
- Abiotic impacts - When the authors studied the effects of abiotic factors (e.g fire, hurricanes, rain, fertilisers, droughts, etc)
- PVA - When the authors report a Population Viability Analysis of an endangered species
- Species dynamics description - When there is no actual treatment in the study (Unmanipulated). Instead, the goal was to describe the natural dynamics of a species
- Interspecific interactions - When the authors studied the interactions between different species (e.g herbivory, pollinators, inter-specific competition, predation, parasitism, etc)
- Management evaluation - When the authors explored the effects of a specific management plan (e.g. to eradicate an invasive species, to preserve an endangered species or assess effects of management on other species).
- Methodological advancement - When the novelty of the paper is not an ecological question, but mostly to introduce a new mathematical tool often using already published matrices.
4.7.10 Embargo
If the author does not wish to make personally communicated data available, the data will be under embargo until this date. A week before that date, an automatic reminder will go out to the author instructing them to contact us if they wish to extend the embargo or remove the data from the database; otherwise, the data will be released and included in the next version update of the databases. Leave blank when there is no embargo.
4.7.11 Additional Source
Record all additional sources used to construct matrices or to obtain additional ancillary data. Additional sources should be formatted as “LastName Journal YearPublished DocumentTitle” (e.g. Godinez-Alvarez Bot Rev 2003, Schmidt J Ecol 2007 Appendix A1) both here and in the attached file names. Be sure to update both whenever changes are made to the data associated with the publication. Attach the necessary PDF/Excel files/documents to the “Attach a Document” field.
4.7.12 Additional Notes
This field is intended to record any important issues or general notes about the data for the use of the digitization team. These entries should only include sensible informative key points that others can understand. Use English only.
4.7.13 Missing Data
Data that is not yet available and thus not yet digitized for this publication. Update this information whenever changes are made to populations and matrices associated with this publication.
4.7.14 Treatment
Record all treatment categories used in the study. Include both environmental and experimental treatments. Write “No” if nothing was manipulated.
4.7.15 Within Site Replication
Number of plots or transects sampled at each population and the size description of the plots. For example, 6(4x4m^2) means that in each population, there were 6 permanent plots of 4x4m2. If different populations have different plot sizes, record all of them separated by semicolon. (e.g. A: 2(15ha); B: 3(20ha))
4.7.16 Study Start (Year)/Study End (Year)
The start and end years of the surveys/censuses/experiments in the study. Record Simulation if data are from a simulation and not associated with any real-world surveys/censuses/experiments. An alert will appear if the start year is greater than the end year, or if the year recorded is greater than the current year.
4.7.17 Release Version
The Version number of the database where the data were released (no longer applies). Do not enter anything here.
4.7.18 Database source
The institute that collated the data together in a mini database before COMPADRE and COMADRE were developed. Do not enter anything here.
4.7.21 Date Contacted
Record the date(s) when the publication author was contacted asking for information in US date format (mm/dd/yyyy). Authors should always be contacted from the contact@compadre-db.org email address rather than a personal email address. If you encounter technical difficulties when attempting to contact an author, contact your lead for additional instructions.
Procedure for lack of response depends on the Year of Publication of the source:
- For papers older than 1990: When the corresponding author does not reply to your third email, or you cannot find their email address (e.g. in old publication) or reach their coauthors, then change the publication status from “Digitizing” to “Review-ready.”
- For more recent papers (published after 1990): If the authors (and coauthors) do not reply after the third time you have contacted them, please pass the email address that you have sent them, together with a brief summary of the information you are after and the attached PDF to Owen and Rob. If they do not make successful contact with the authors, they will change the publication status from “Digitizing” to “Review-ready.”
If you were not able to find an email address of any of the authors of a paper (and also Rob and Owen don’t know one), but that paper has a matrix population model that can be digitised – enter the matrix and all information that are available from the paper. All missing information get an NA and we list the species as “Review-Ready”, still enter the missing information into Missing Data field.
4.7.22 Date Contacted Again
Date(s) of the other attempts to contact this corresponding author. (mm/dd/yyyy; mm/dd/yyyy). Make another attempt to contact the author again if there has not been a response in 3 months.
4.7.23 Sent Email Content
This records the information that was requested from the author. Use the same format as for “Missing Data” above. If multiple pieces of information are requested, separate with “;”. If the author has been asked for something other than the standard missing information, a short note should be left, e.g. “is the species clonal?”
4.8 Protocol for the Population form
4.8.1 Status
This is the status for the population. Please READ the website-status protocol to determine the status that should be assigned to the population.
* Digitizing – digitiser is working/editing the population
* Rejected/Deleted
* Awaiting info – digitiser has determined more information is required to complete digitization
* Review-Ready – the population is ready to be reviewed by a database curator
* Released – population can be now seen by public users
* Error – an error has been found in the population and needs to be corrected
4.8.2 Species Accepted
Currently accepted Latin binomial or trinomial name for the species.
- Search for the correct species name. This might be different from the Latin name the author used (e.g. author used an old Latin name for the species). If you cannot find the correct species name in this field, contact a website administrator.
4.8.4 Population Name
The name of the population where the data for the matrix was recorded. Usually given by the author. When no name provided, use other characteristic information, such as a brief geographic location (e.g. Monterey Bay, Gifford Pinchot Southeast, etc.). If there are multiple populations in the study and their names are not pertinent/available, sequential names in alphabetical order are assigned for each population in the study (e.g. Population A, Population B, etc.).
4.8.5 Species Common Name
The common name for the species. This is pulled automatically from the selected species but can be overwritten if desired/needed.
4.8.6 Ecoregion
Description of the Ecoregion associated with the population. Follow the link to obtain the ecoregion for the set of coordinates the population is located in: https://patrickbarks.shinyapps.io/biomes/
The options are:
Terrestrial ecoregions
TMBtropical and subtropical moist broadleaf forestsTDBtropical and subtropical dry broadleaf forestsTSCtropical and subtropical coniferous forestsTBMtemperate broadleaf and mixed forestsTCFtemperate coniferous forestsBORboreal forests/ taigaTGVtropical and subtropical grasslands, savannas and shrublandsTGStemperate grasslands, savannas, and shrublandsFGSflooded grasslands and savannasMONmontane grasslands and shrublandsTUNtundraMEDMediterranean forests, woodlands and scrubsDESdeserts and xeric shrublandsMANmangroves
Freshwater ecoregions
LRElarge river ecosystemsLRHlarge river headwater ecosystemsLRDlarge river delta ecosystemsSREsmall river ecosystemsSLEsmall lake ecosystemsLLElarge lake ecosystemsXBExeric basin ecosystems
Marine ecoregions
POEpolar ecosystemsTSStemperate shelf and seas ecosystemsTEUtemperate upwellingsTRUtropical upwellingsTRCtropical coral
For a more inclusive description of water ecoregions, see http://worldwildlife.org/biomes
4.8.7 Country
Choose the ISO 3 Country Code(s) of where the population is located. You can search by the country’s name or the country’s code. Enter NA for populations only studied in international waters (see Population Nautical Miles below).
4.8.8 Population Nautical Miles
For oceanic studies, this is the distance in nautical miles from the closest land mass. If the population was studied both in French and Spanish waters 8 miles from land the country code field would be FRA; SPA and the nautical miles field would be NODC-8. If it was only studied in international waters (normally defined as 12 nautical miles from land) then you would record it as NODC-22 in this field and NA for Country.
4.8.9 Continent
Continent where the population is located. Select the appropriate one:
AfricaAsiaEuropeN America(includes Canada, USA and Mexico)S America(incluces the rest of the countries in the Americas not outlined in “N America”)AntarcticaOceania(various definitions for Oceania exist, but here we opted for this one: https://en.wikipedia.org/wiki/List_of_Oceanian_countries_by_population)
4.8.10 Matrix Criteria Size
Records whether the matrix model is based on size (e.g. stem length/number, body length/mass, etc).
Yes- The matrix population model contains at least one stage based on size.No- The matrix population model is not based on size.
4.8.11 Matrix Criteria Ontogeny
Records whether the matrix model is based on ontogenetic stage (e.g. seedbank, reproductive, vegetative, dormant, etc).
Yes- The matrix population model contains at least one class that is based on development/ontogeny (e.g. seedbank, reproductive, vegetative, dormant, etc).No- Matrix population model is not based on ontogeny.
4.8.12 Matrix Criteria Age
Records whether the matrix model is based on age.
Yes- The matrix population model contains at least one class that is based on age (e.g. individuals of 0 year old)No- The matrix population model is not based on age
4.8.13 Coordinates and Altitude
Get coordinates from https://www.gps-coordinates.net/
Estimate the geographic coordinates to the nearest location possible. Check if they reasonably fit the location of the study by looking them up on Google Maps or Google Earth. If the terrestrial plant or animal has aquatic coordinates, obtain the coordinates by estimating them from the study site provided by the authors.
When geographic coordinates are not attainable, select an option that corresponds with the study situation. The possible options are LAB, Simulation, NC, FRANK, and AFI.
NC(Not Calculated): When the matrices are built from mean or pooled data of multiple populations with different study locations. Record each geographic coordinate in theObservationsfield of the matrix form.LAB(Laboratory): When the study was carried out in a laboratory or under greenhouse conditions where study populations were not affected by the environmental conditions of the actual geographic location.FRANK(Frankenstein matrix): When the matrices are constructed from two or more sources that were in different conditions. Enter the main geographic coordinates when available. For FRANK studies, specify that it is a FRANK study in theObservationsfield of the matrix form with a brief summary of the methods. (e.g. FRANK; Survival rates estimated from the field study, but fecundity values obtained from a greenhouse study).Simulation: Theoretic studies that are not or are loosely based on a real population.AFI(Asked for it): contacted the author for the information but the author hasn’t replied yet.
4.8.14 Coordinates Format
Select the adequate format for the coordinates of the population. Options include:
Degrees, minutes and seconds (DMS)Decimal degreesLABSimulationNCFrankAFI
4.8.15 Latitude Degrees / Latitude Minutes / Latitude Seconds
Record the degree (0-90), minute (0-60) and second (0-60) values of the locations of the matrix.
Note: if there are no seconds (or minutes) given, you should record as NA rather than 0.
4.8.16 Latitude N or S
Cardinal direction
* N - North
* S - South
Note: Cardinal direction might be given with a “+” or “-” whereat “+” means North and “-” means South.
4.8.17 Longitude Degrees / Longitude Minutes / Longitude Seconds
Records the degree (0-90), minute (0-60) and second (0-60) values of the locations of the matrix.
4.8.18 Longitude W or E
Cardinal direction
* W - West
* E - East
Note: Cardinal direction might be given with a “+” or “-” wherby “+” means East and “-” means West.
The following link is useful for converting between different ways of presenting lat/long information: http://www.earthpoint.us/Convert.aspx
4.8.19 Altitude
Altitude of studied population in meters (m). Height above or below sea level of specific population (e.g. 208, -55, 1677 (without “m”)).
Note: Altitude is either given in the paper, by author communication, or we look it up with Google Maps. If you enter the coordinates into Google Maps you’ll see the altitude at the bottom right corner of the window. Note: If you scroll around in Google Maps with your mouse the altitude will change, so pay attention that you read the altitude directly after entering the coordinates without scrolling around!
4.8.20 General notes on location information:
If you don’t have a detailed description of the geolocation-coordinates, enter the following sentence into the Observations field of the matrix form: The GPS coordinates were approximated to the closest geographic location described in the reference.
Sometimes the latitude and longitude given in the paper DO NOT match the study area. In this case enter the following in the Observations field of the matrix form: GPS coordinates cited exactly as reported in original paper. These do not match written study site description.
Pay attention to the means: We do not calculate ranges for mean matrices. In that case, choose the option NC for “not calculated” in the “Coordinates Format” field.
4.9 Protocol for the Matrix Metadata (New Matrix Set) form
4.9.1 Composition
Indicates the type of matrix population model.
Individual- single population studied over a single time period, for example, over one yearMean- a mean matrix was calculated by averaging across more than one population studied over a single time period, for example, over one yearPooled- a matrix was calculated by pooling data across more than one population studied over a single time period, for example, over one yearNDY- not digitised yet / unset
4.9.2 Seasonal
A matrix population that does not describe a full annual transition, but rather a seasonal transition.
- Specify the seasons in the “Start Season” and “End Season” fields of the matrix form.
A matrix can be seasonal even if it is constructed over several years (e.g. spring in years 2000-2012). Make sure you detail that there are multiple years data in the Observations field of the matrix form.
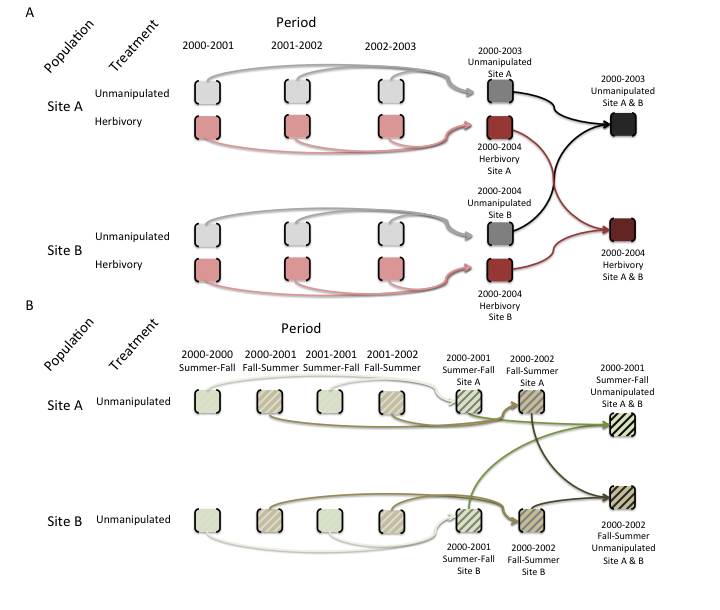
This figure is a schematic showing how mean population matrix models are derived from all available population matrix models in a study. A. For annual population matrix models (those that follow population dynamics from one year to the next, or sometimes more – some tree species are studied with a 5-year interval), element-by-element means are first calculated across the population matrix models describing the population dynamics for time periods within each population. Then the grand element-by-element mean is calculated across the matrix population models for the different populations. This procedure is repeated for models describing dynamics under each imposed treatment (pink matrices below) and for those describing the dynamics of unmanipulated populations (gray). Note that mean population matrix models are only calculated from population matrix models that share the same treatment (or absence of treatment). B. For seasonal or periodic population matrix models (e.g. for annual species), the mean seasonal population matrix model is calculated within populations and then across populations, both for matrices describing treated populations and for those describing populations with no imposed treatment (i.e. unmanipulated).
4.9.3 Dimensions
Select the dimension of the matrix.
- Expand the drop-down menu and type in the number to navigate faster.
4.9.5 Class Organized
We standardise all stages in a given population matrix model to one of three stages (prop, active, dorm) to facilitate analyses.
- prop - Propagule (seed). This applies to every stage defined by the author as seed bank or seed. Users are encouraged to carefully examine matrices with these stages and to implement the appropriate calculations to avoid a spurious additional year being added when no seedbank exists in the study species, as explained by Caswell (2001, p. 60).
- active - This includes stages that can neither be placed in the “prop” nor “dorm” (see below) stages.
- dorm - A stage that is vegetatively dormant after having germinated and becoming established.
4.9.6 Start Year
First year of the matrix. Year t in matrix population model that describes population dynamics from time t to t+1 (e.g. 1995).
4.9.7 End Year
Last year of the matrix. Year t+1 in matrix population model that describes population dynamics from time t to t+1 (e.g. 2001).
4.9.8 Start Month/End Month
Record the start and end months if provided.
- For monthly transition matrices, record the start month and end month (m to m+1).
- If demographic information was collected during a period of time, please state the period separated by a hyphen (e.g.
6-8for June through August) in theObservationsfield in the matrix form.
4.9.9 Start Season/End Season
Record the start season and end season for the seasonal matrices.
4.9.10 Census Type
Choose the type of sampling census the authors use (see Kendall et al. 2019 for additional details). The authors may have specified if they sampled before or after reproductive events. If this is not provided in the publication, please contact the corresponding author.
Prebreeding- Population was censused before a birth pulsePostbreeding- Population was censused after a birth pulseIntermediate- Population was censused between successive birth pulses (e.g. bears give birth while hidden in winter dens, which makes pre- or post-breeding censuses impracticalBirth-flow- Population for which reproduction occurs continually over an interval (e.g. humans)NDYAFINA
4.9.11 Projection Interval
The time step (periodicity) of the transition matrix. Be aware this is NOT equal to sampling frequency. If a matrix has 6-month projection interval, it would be 0.5 since it is 0.5 years. In the same way, if a matrix has 5-year projection interval, it would be 5.
4.9.12 Split
Divisible if enough information is given to divide the survival and reproductive portions of the matrix. The matrix is divisible when there is no reproductive portion in the A matrix. Usually, indivisible matrices contain mixed cells in A matrix that cannot be divided into U, F, and C matrices due to insufficient information.
- An A matrix should ALWAYS be recorded, even if no reproduction data was available.
Divided- The matrix population model A has successfully been divided into the process-based sub matrices U, F and C.Indivisible- The matrix population model A has not been divided into the process-based sub-matrices U, F and C (see Figure below for further details) because insufficient information is available to classify the various demographic processes for each sub-matrix. In indivisible matrices, only A (see below) is presented
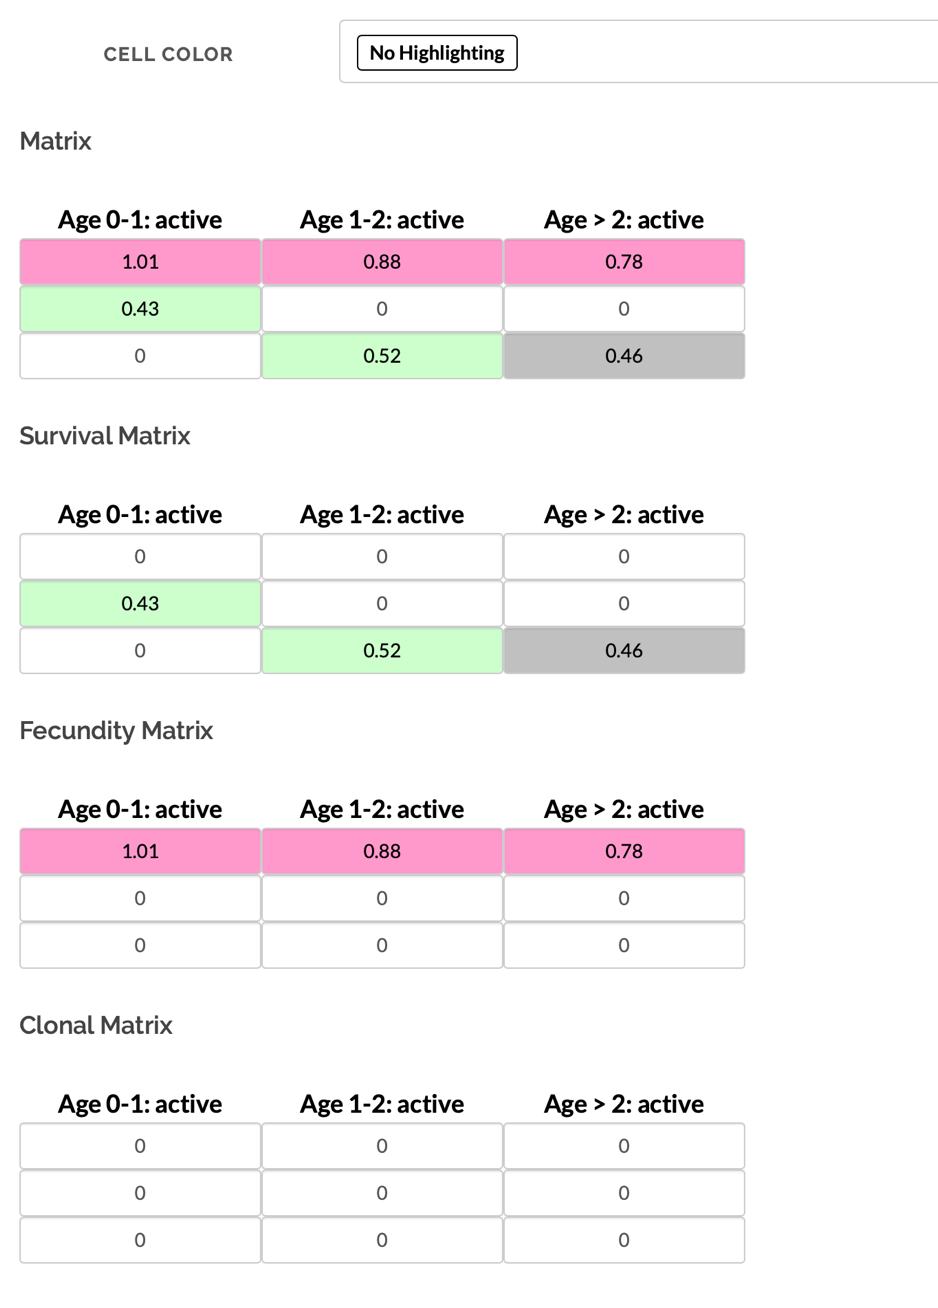
This is how a divided matrix could look like (species: Troglodytes troglodytes):
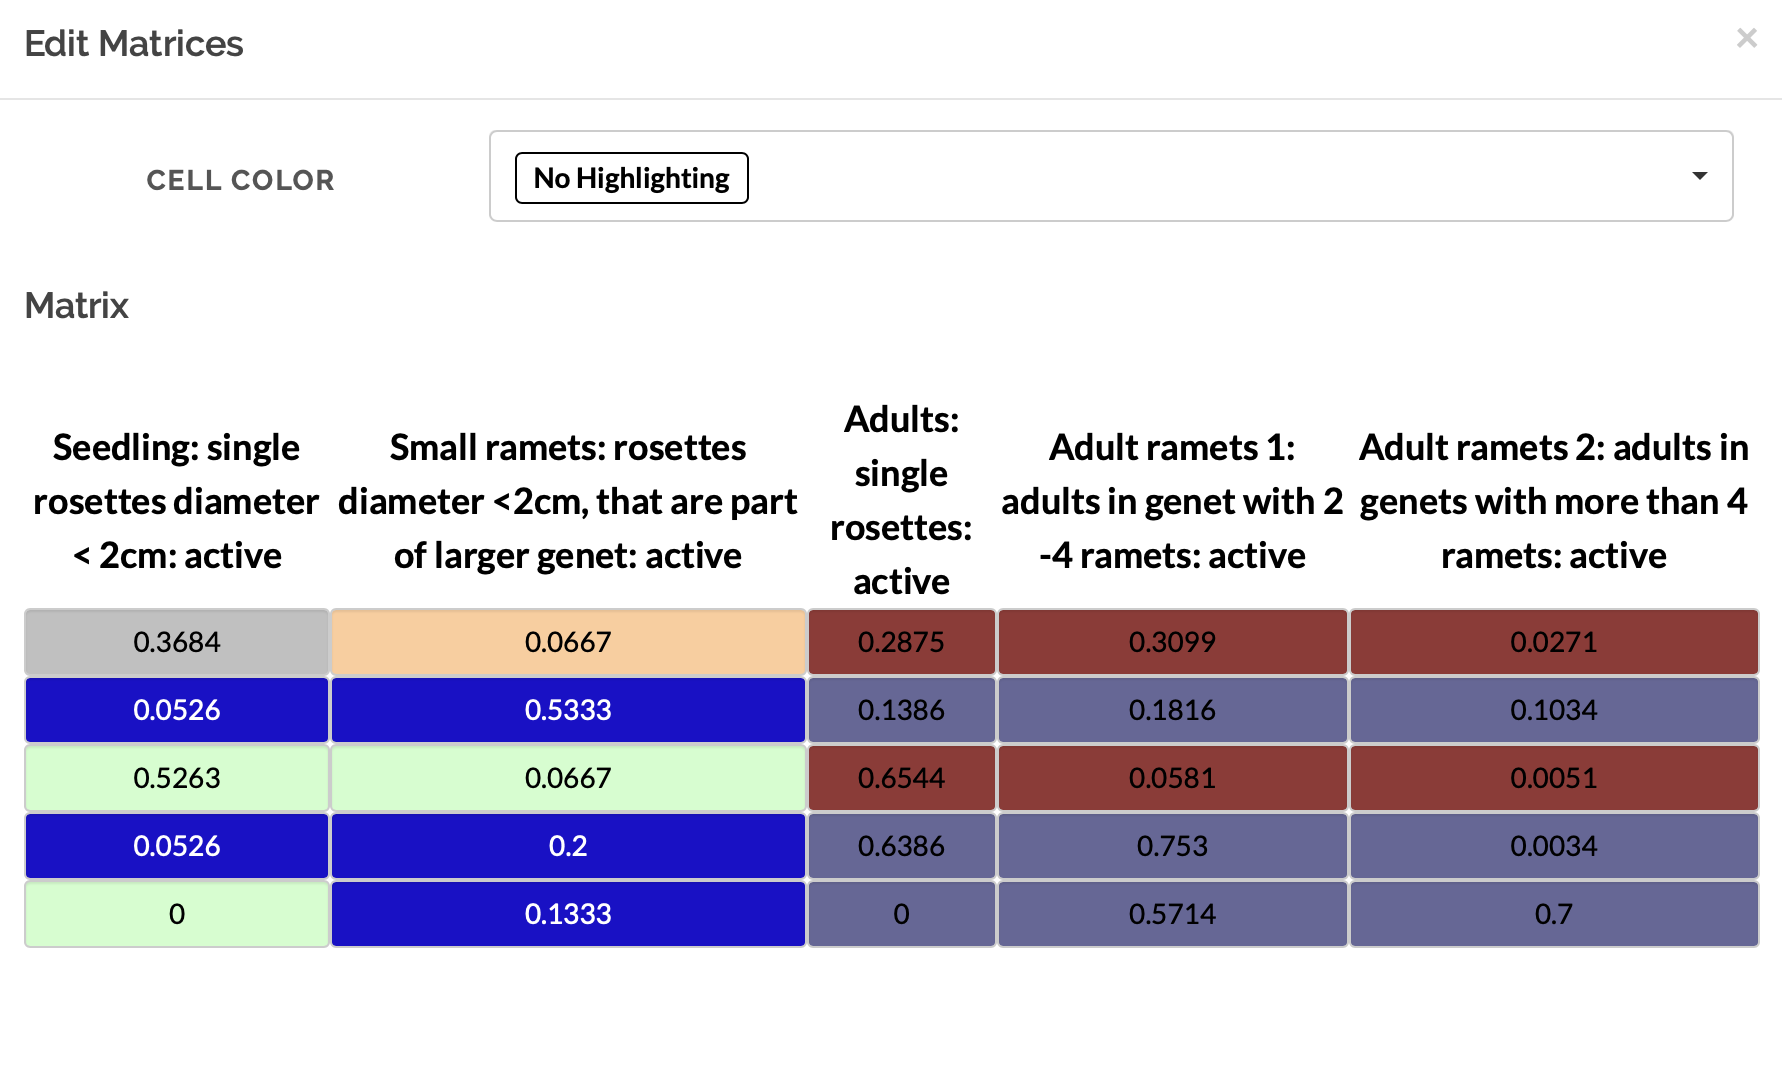
This is how an indivisible matrix could look like (species: Syngonanthus nitens):
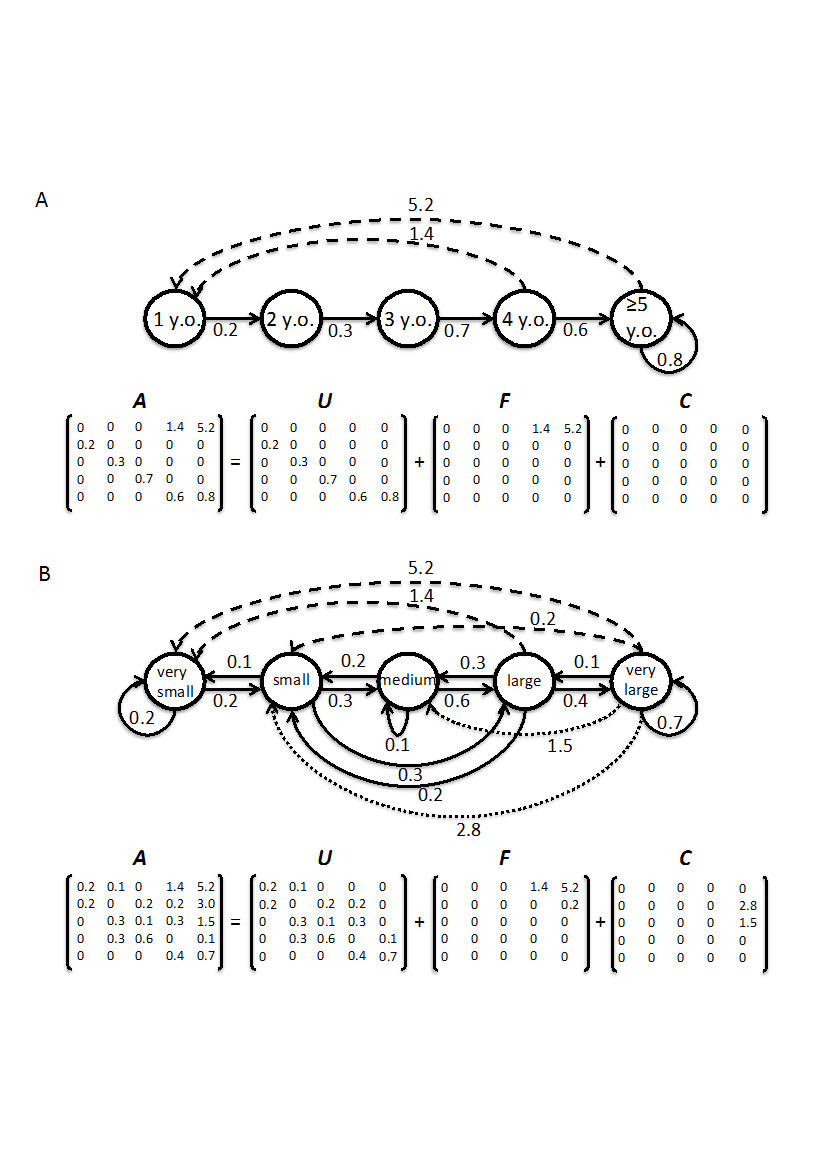
The diagram below shows the life cycle of two hypothetical plant populations based on age (A) and size (B), with their corresponding matrix population models. A, and underlying basic demographic processes of survival (U sub-matrix; solid arrows), sexual reproduction (F sub-matrix; dashed arrows) and clonal reproduction (C sub-matrix; dotted arrows). This model includes “retrogression” or shrinkage in addition to “progression” or growth. In the Leslie matrix model example (A), the division of sub-matrices is more straightforward than in the Lefkovitch matrix model example (B). In the latter imaginary example, individuals can transition into the same stage as they can contribute with sexual and/or clonal offspring (e.g. small stage). In these cases, splitting A into sub-matrices U, F and C is only feasible when sufficient information is provided by the authors (see variable Split).
4.9.13 Fecundity
This records whether fecundity was measured at all for this matrix model. This will help distinguish whether a 0 in the fecundity transition(s) indicates no fecundity or fecundity was not measured. We include fecundity, recruitment, or sexual reproduction here ignoring the technical differences.
The rationale for this is that a fecundity (in the F matrix) may be recorded as 0 either because it was not measured, or because reproduction was estimated to be zero. As a general rule, if any values for fecundity (e.g. in the F matrix) are non-zero, then Fec should be recorded as ‘Yes’. If all values are zero, then you should check the paper carefully to check whether this is because no fecundity was detected, or whether no attempt was made to measure fecundity. There are some technical differences between fecundity, sexual reproduction, and recruitment. For the purposes of Fec these differences do not matter - if estimates fecundity, recruitment or sexual reproduction are collected, Fec = “Yes”.
Yes- fecundity was measured for the matrixNo- fecundity was not measured for the matrixNA- it is not known whether fecundity was measured for the matrix
4.9.14 Treatment
A brief description of experimental treatments of the population intentionally imposed by humans.
- Write “Unmanipulated” if no experimental, human-imposed treatment was applied. Natural events of non-intentional occurrence should be recorded in the treatment in the publication form and in observations column here, especially if they are used as an explanatory factor in the study.
- For example, population dynamics could be compared in disturbed vs. undisturbed areas. In these cases MatrixTreatment should be recorded as “Unmanipulated”, a note should be added in Observation and the name of the population should include a clear indication of the conditions. e.g. “Population 1 - disturbed”, “Population 2 - undisturbed”.
4.9.15 Captivity
Select the following options:
W– Wild: Studied in natural conditionsC– Captive: studied for most part of the life cycle of the species in a botanical garden, greenhouse, laboratory, etc.CW– Captured from wild: if the species was taken from a wild population but studied in labs or garden.C;W– Mixed studies that incorporate vital rates from both captive and wild populations
4.9.16 Studied Sex
Indication of the sex(es) considered when constructing the matrix population model.
M- Studied only malesF- Studied only femalesH- HermaphroditesM/F- Males and females separately in the same population matrix modelA- All sexes togetherNA- There are no distinct sexes (e.g. a virus)
4.9.17 Source(s)
Where the data was obtained to construct the matrix. If the data is from an appendix that is attached at the end of the original publication, record it as “Paper” and NOT as “Online Appendix”. “Online Appendix” is only for appendices that are in separate documents. Reselect the option to unselect it. If sources other than those below are used, a short but useful description should be given. The aim of this field is that everybody can find the related information ASAP e.g. if something needs to be fixed.
- Altered - the original published matrix was altered for accuracy. Include specific reason(s) for why the changes were made (e.g., seed bank issue, typo corrected through author communications, recalculating from pre-breeding to post-breeding, etc.) and information on how you calculated the matrix in the observation field.
- Author communication - Matrices derived from personal communication with author.
- Book: Matrices come from a book or book chapter
- Calculated - digitiser self-calculated the matrix from a life table or other data sources. Include what the original data type is (e.g. life table, integral projection model, individual-based model, etc.) and information on how you calculated the matrix in the observation field.
- Database - Matrices derived from one of the various databases that have been merged into COMPADRE/COMADRE see Database above.
- Old matrices - Matrices derived from an old matrices file (no more detailed description is available)
- Online appendix - The matrices come from an online appendix that is not attached at the end of the original publication. Must be a separate document.
- Other sources - The matrices came from a source not listed here. Include more details in the
Observationsfield of the matrix form. - Paper - Matrices derived from a published manuscript.
4.9.18 Observations
Add any useful information about the population matrix. (e.g. geographic coordinates of pooled populations, unusual estimations or treatments, etc.)
Some standardised sentences:
- The GPS coordinates were approximated to the closest geographic location described in the reference. (see Geolocation)
- GPS co-ordinates cited exactly as reported in original paper. These do not match written study site description. (see Geolocation)
- Geolocation / Altitude from descriptor: (if no matrices are entered yet but a geolocation information are available)
- Matrix is calculated with stochastic model
- X years since last fire
- Calculated with demographic data from Author JournalName YearPublished
- Data is from a greenhouse experiment
- Matrix Class Author is not clarified
4.9.19 Create/Edit Matrix
After saving the “New Matrix Set” form, the matrices can be added from the population form under the “Population Matrices” tab. These are the population matrix models. Including the overall matrix (A) and, where possible, the sub-matrices U (survival), F (fecundity), C (clonality). A range of numeric values is possible in each element of the matrix. Sometimes only a U matrix is available because data on reproduction were not collected. In these cases the U matrix should be used as the A matrix, and a note recorded in Observations.
- The A matrix - The overall matrix including all processes. The A matrix can usually be “split” into consituent processes represented by the U, F and C sub-matrices such that A = U + F + C. Transition probabilities are constrained between 0 and 1. Reproductive values are always positive but have no upper bound.
- The U matrix - The population sub-matrix model U (a sub-matrix of A), describes the survival-dependent dynamics of a population under the conditions described above. Values are constrained to be between 0 and 1. These include only survival-dependent vital rates (no sexual or clonal reproduction). If only the U matrix is available, it should also be used as the A matrix (see “The F matrix” below).
- The F matrix - The population sub-matrix model F (a sub-matrix of A), which describes the sexual-reproduction dynamics of a population under the conditions described above. A range of numeric values possible, but are constrained to be positive. These include only estimates of sexual reproduction (no clonal reproduction). Sometimes sexual reproduction is not recorded (e.g. because it was not the focus of the study). This should be noted in observations and recorded using Fec (see elsewhere in this guide). Where possible, the “known unknowns” should be recorded as NA. For example, if you know that the “adult class” reproduces sexually, but simply was not estimated you should record NA for that element’s fecundity, and “No” for Fec.
- The C matrix - The population sub-matrix model C (a sub-matrix of A), which describes the clonal-reproduction dynamics of a population under the conditions described above. A range of numeric values are possible, but these are constrained to be positive. These include only estimates of clonal reproduction. Where there is no clonality, this matrix should be included, but will be all 0 values.
The values for the U, F and C matrices are only digitised for “Divided” matrices (indicated in the field Split).
4.9.20 Notes for matrix construction:
- Each cell represents transition from the column stage to the row stage.
- You may enter a number or NA (Not Available).
- For survival rates, the values are restricted between 0 and 1. The sum of the survival rates from a single stage (column) should not exceed one. An popup alert will be generated when this happens.
- Reproductive values do not have upper bounds but should not be a negative number. This also applies to compound cells where survival rates and reproductive values are combined.
- “0” should not be colored.
- Values across the U, F, and C matrices should add up to the A matrix. If there is not enough information to divide compound cells in A matrix, the matrix should be marked “Indivisible” and only A matrix should be recorded.